![]()
Airfoil and aircraft polars have been used for a long time in aeronautics. The correct German term is "Lilienthal'sches Polardiagramm", indicating that this method of graphing results of airfoil tests has been used first by Otto Lilienthal. He plotted the lift and drag forces of his experimental results as lift versus drag, as we still use it today (using coefficients instead of the actual forces). Additional graphs have been developed to plot relations between other coefficients in a similar way.
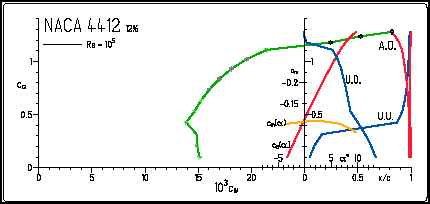
| The combined polar diagram shows a lot of information,
condensed in a very compact format. It has been used by Prof. Eppler for
the output of his airfoil analysis program and is used on most of my web
pages. In order to understand the different parts of the plot, I have
colored the individual sections individually and pulled them apart in the
pictures below. Remark: The data in these diagrams are valid for the two dimensional airfoil, not a wing, if not noted otherwise! To find the characteristics of a wing, the geometry of the wing has to be taken into account. Nevertheless, the airfoil polars are a useful means of screening possible candidates for a certain application. |
 |
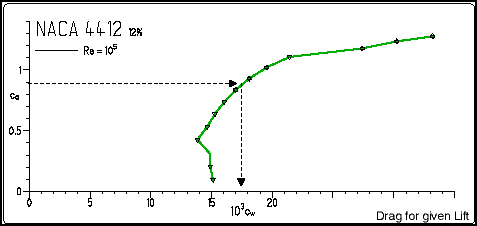
| The "drag polar" specifies the drag coefficient Cd
for a given lift coefficient Cl (and vice versa). This is often
the most important part of the results and can be used to find the best
climb or sink rate as well as the optimum glide angle ideally possible
with this airfoil. For a given lift coefficient of 0.89, we read a drag
coefficient of 17.5 / 10³ or 0.0175 from the graph.
To find the best glide ratio, you have to draw a line from the origin (Cl=0/Cd=0) tangentially to the curve. Read the values of Cl and Cd at the point where the line touches the curve and calculate Cl/Cd, the glide ratio. |
 |
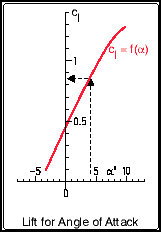
| The "lift polar" shows the lift coefficient Cl,
plotted versus the angle of attack alfa. It answers questions
like "what will be the lift of the airfoil for a given angle of
attack?" Or, the other way round, "what angle of attack is
needed for a given lift coefficient?". Also, it is possible to find the maximum lift coefficient of the airfoil and the corresponding angle of attack, and it may be possible to get information about the stall behavior, presuming that the analysis code is able to make a realistic prediction or plots of experimental results are available. For a given angle of attack of 4 degrees we find a lift coefficient of approximately 0.85. The maximum lift coefficient will be in the order of Clmax=1.3. |
 |
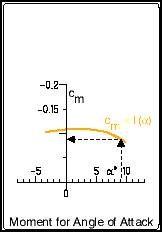
| The "moment polar" is similar to the "lift polar",
but shows the moment coefficient Cm of the airfoil section
instead of the lift coefficient versus the angle of attack a.
For an angle of attack of 9.1 degrees, we find a corresponding moment coefficient of -0.09. A negative moment coefficient indicates a pitch down tendency for the reference point at 25% of the chord length. |
 |
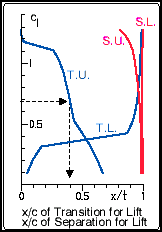
| These four lines indicate the location of the transition (T.)
of the flow (from laminar to turbulent) and of the turbulent separation (S.),
respectively. Locations are given for the upper side (U.) as well
as for the lower side (L.). These locations x/c are
plotted versus lift coefficient Cl on the vertical axis.
In this example the transition on the upper surface (T.U.) at a lift coefficient Cl of 0.68 is taking place at 40% of the chord length. On the lower surface (T.L.) we find the transition far downstream, at 95% of the chord length. The points of separation are approximately at 95% on the upper surface (S.U.) respectively at the trailing edge for the lower surface (S.L.). Usually, the drag coefficient Cd is lower for transition located further downstream. Separation should be close to the trailing edge and move slowly forward, when maximum lift is reached. |
 |
Last modification of this page: 21.05.18
![]()
[Back to Home Page] Suggestions? Corrections? Remarks? e-mail: Martin Hepperle.
Due to the increasing amount of SPAM mail, I have to change this e-Mail address regularly. You will always find the latest version in the footer of all my pages.
It might take some time until you receive an answer
and in some cases you may even receive no answer at all. I apologize for this, but
my spare time is limited. If you have not lost patience, you might want to send
me a copy of your e-mail after a month or so.
This is a privately owned, non-profit page of purely educational purpose.
Any statements may be incorrect and unsuitable for practical usage. I cannot take
any responsibility for actions you perform based on data, assumptions, calculations
etc. taken from this web page.
© 1996-2018 Martin Hepperle
You may use the data given in this document for your personal use. If you use this
document for a publication, you have to cite the source. A publication of a recompilation
of the given material is not allowed, if the resulting product is sold for more
than the production costs.
This document may accidentally refer to trade names and trademarks, which are owned by national or international companies, but which are unknown by me. Their rights are fully recognized and these companies are kindly asked to inform me if they do not wish their names to be used at all or to be used in a different way.
This document is part of a frame set and can be found by navigating from the entry point at the Web site http://www.MH-AeroTools.de/.